
A WordPress plugin niche has room to grow when its install concentration ratio - the share of combined installs held by the top three listings - stays low enough that a new entrant isn't just fighting over scraps (the same math works for a theme niche, too). That's the headroom test. Three other signals decide whether the test is even worth running.
This post covers the concentration-ratio lens specifically. A niche can pass this test and still fail a different one - see how that plays out against finding underserved niches below.
View the Niche Health Dashboard
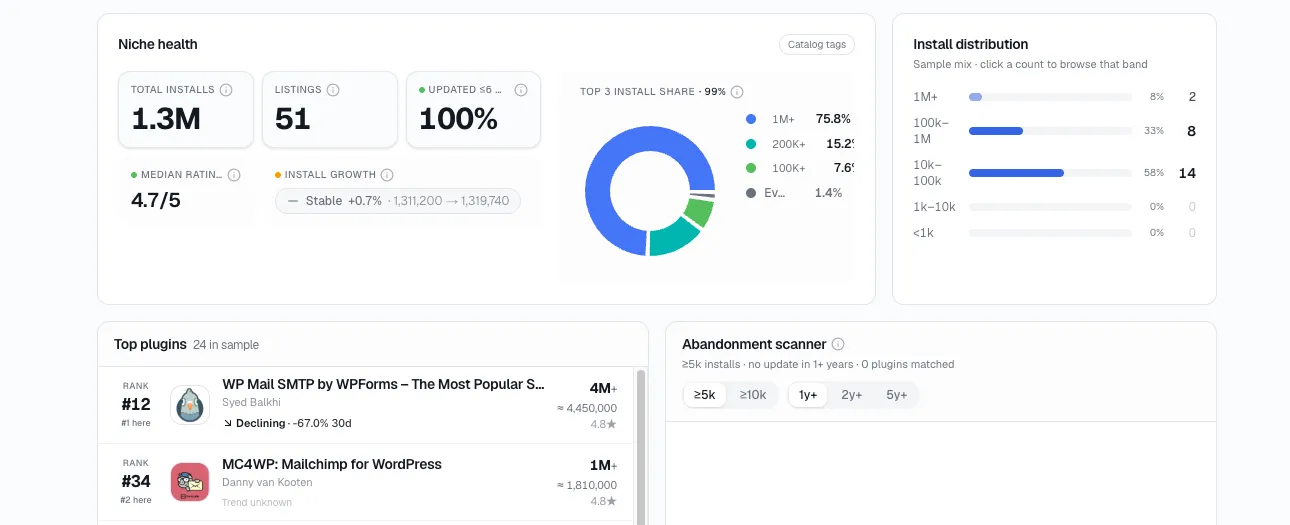
Here's the read: A WordPress plugin niche has room to grow when its install concentration ratio - the share held by the top three listings - stays low enough that a new entrant isn't fighting over scraps; that's the headroom test this post covers.
The headroom test: what a concentration ratio actually is
Add up the combined installs of a niche's top three listings, divide by the niche's total combined installs, and you get the concentration ratio - a single percentage that says how much of the category's demand is already spoken for by a small handful of plugins.
I haven't found a universal cutoff that applies to every niche the same way - a tiny, newly formed niche and a mature 40-listing category behave differently at the "same" ratio. Treat the number as relative, not absolute: the lower it sits, the more of the niche's demand is still up for grabs; the higher it climbs, the more it's already been claimed by a few plugins.
Do the math on two otherwise identical niches
Here's what that looks like worked out, using a hypothetical niche sized at 18,400 combined installs across 24 listings:
Scenario one: the top three listings hold 7,300 of those 18,400 installs combined. 7,300 ÷ 18,400 ≈ 40% concentration.
Scenario two: same 18,400-install niche, but the top three listings hold 15,600 of them instead. 15,600 ÷ 18,400 ≈ 85% concentration.
Same total demand, same listing count, same everything else you'd glance at first - and a completely different amount of headroom. In scenario one, more than half the niche's installs are spread across the other 21 listings, which means users are actively trying alternatives instead of settling on one answer. In scenario two, three plugins have already absorbed almost everything, and a new entrant is competing directly against entrenched leaders for the installs those three already hold.
If you're screening several candidate niches at once, rank them by concentration ratio, lowest first, and cross off anything that fails the growth check before spending time on the rest. I'd look closer at a niche near 40% with strong growth before one near 85%, even if the 85% niche has a larger total install base - raw size doesn't buy back headroom that's already been claimed by a few plugins.
Three checks to run before the ratio even matters
I don't treat a low concentration ratio in a shrinking, abandoned, or already-massive niche as good news. Run these three first:
Install growth is positive. A niche with combined installs climbing over the trailing months is behaving differently than one that's flat or sliding. Without growth, a low concentration ratio just means nobody's winning a category nobody wants.
The listing count isn't already enormous. A low ratio spread across 150 listings gives a new entrant far less real room than the same ratio spread across 20 - more listings means more competitors splitting whatever isn't already claimed.
A healthy share of listings are still maintained. If most of the niche hasn't shipped an update in two years, a low concentration ratio might just mean the category quietly died before anyone claimed it, rather than that it's still open for the taking.
When one good number is hiding three bad ones
The failure pattern I watch for: installs are growing, the concentration ratio looks reasonable, but almost all of that growth belongs to the top two plugins and most of the rest of the listings are stale. Run the ratio on the wrong slice of time or the wrong metric and it can look open when it isn't - I'd call that a niche with a winner, not a niche with room, and a subtly different, much less useful finding than it first appears.
Room to grow isn't the same thing as underserved
It's easy to conflate this with a related but different question. Finding underserved niches looks at whether the total number of listings is low relative to demand - a niche can have very few competitors at all. This post looks at whether installs are locked up among the players that do exist, regardless of how many there are.
A niche can have room to grow (a low concentration ratio) while having plenty of listings - just none of them dominant. And a niche can be genuinely underserved (barely any listings exist) while still showing a high concentration ratio, because the two or three plugins that do exist happen to have split the small install base evenly. I think of these as different lenses on the same category - checking one doesn't tell you the other.
Where to run the numbers
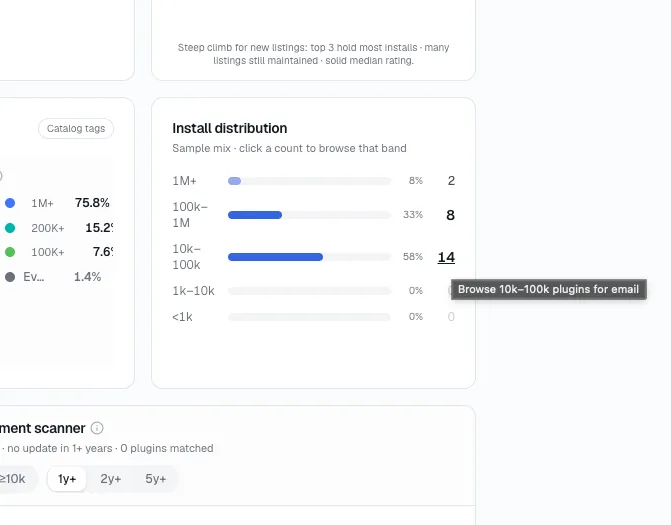
Open StatWP's Niche Research tool, pick your niche - plugin or theme - and look at the Niche health panel - it lists all four signals together, so checking them is one lookup instead of four:
Install growth
Listing count
Share updated in the last six months
Top-3 install concentration
Once a candidate clears all four checks on StatWP's niche tool, move to the full niche-sizing process, or run the same niche through the full seven-metric health check for a more complete picture before deciding anything.
Screen a Niche for Room to Grow
Before you screen for room to grow
Is there an official "safe" concentration ratio?
No fixed number applies across every niche. Judge it relative to the niche's size and the other three checks in this guide - growth, listing count, and maintenance - a ratio that would be alarming in a 50-listing category can be normal in a 10-listing one that's still forming.
What if a niche doesn't have a clear top three?
Some very small or very new niches don't have three listings with meaningful installs yet. In that case the concentration ratio isn't a useful test - fall back to the growth and maintenance checks, and treat the niche as too early to score on this specific signal.
Does a low concentration ratio replace the full health check?
No - it's one input. Analyzing a niche's full health looks at concentration alongside six other numbers, and is the step worth running once this screen and the three checks above all clear.
Can a niche pass this test and still be a bad idea?
Yes. A low concentration ratio only says the installs that exist aren't locked up - it says nothing about whether the underlying demand is big enough to matter, or whether a sub-niche gap explains the whole picture. I'd treat a pass here as a reason to look closer, not a reason to build.
Does the ratio change much over time?
It can move faster than total install counts do, since it's a share, not a raw number - one plugin having a bad month or a new plugin suddenly gaining traction shifts the ratio even if the niche's total installs barely move. Check it as a point-in-time read, and re-check it before acting on an older screen.